17 Recession-Proof Housing Markets
The U.S. housing market is on a tear and the majority of Americans expect that housing prices in their area will continue to rise. Despite this optimism, some investors and analysts are questioning whether we are due for another correction. A strengthening economy might suggest that housing prices will continue to go up, but certain leading indicators—like soaring sale prices relative to inflation, stagnant wages, and rising interest rates—bear similarities to pre-2008.
According to the Zillow Home Value Index (ZHVI), which tracks residential real estate prices in the U.S., from its peak in 2007 to the low in 2012, there was a 25.8% decrease in average home value across the U.S. While impossible to escape the effects of the crash altogether, some markets fared far better than others.
To identify which cities are the most “recession-proof,” researchers from financial management platform Credit Sesame, analyzed over twenty years of home value data for the largest 500 U.S. cities. For each city beginning in 1997, its researchers calculated whether the city’s ZHVI would drop by more than 5 percent at any point in the future. From there, Credit Sesame calculated the probability that a homebuyer would experience a greater than 5 percent decrease in value at any time between 1997 and present. The cities identified as recession-proof have a probability of zero. In other words, at no point between 1997 and present did their average home value drop by more than 5 percent.
Takeaways
- Of the 500 largest cities in the U.S., 17 of them never experienced a greater-than-5-percent drop in average home value between 1997 and present.
- The 17 recession-proof cities are concentrated in the South and Midwest.
- While seemingly less susceptible to large drops in value, homes in many of the recession-proof cities did not appreciated as quickly as the national average of 94.0 percent over the past 20 years. However, home value growth in certain recession-proof cities like Fort Collins, Anchorage, and Iowa City far-outpaced the national average.
- The Q1 2018 median list price for the cities on this list does not appear to be significantly higher or lower than the national average of $263,497.
Here are the top 17 recession-proof housing markets
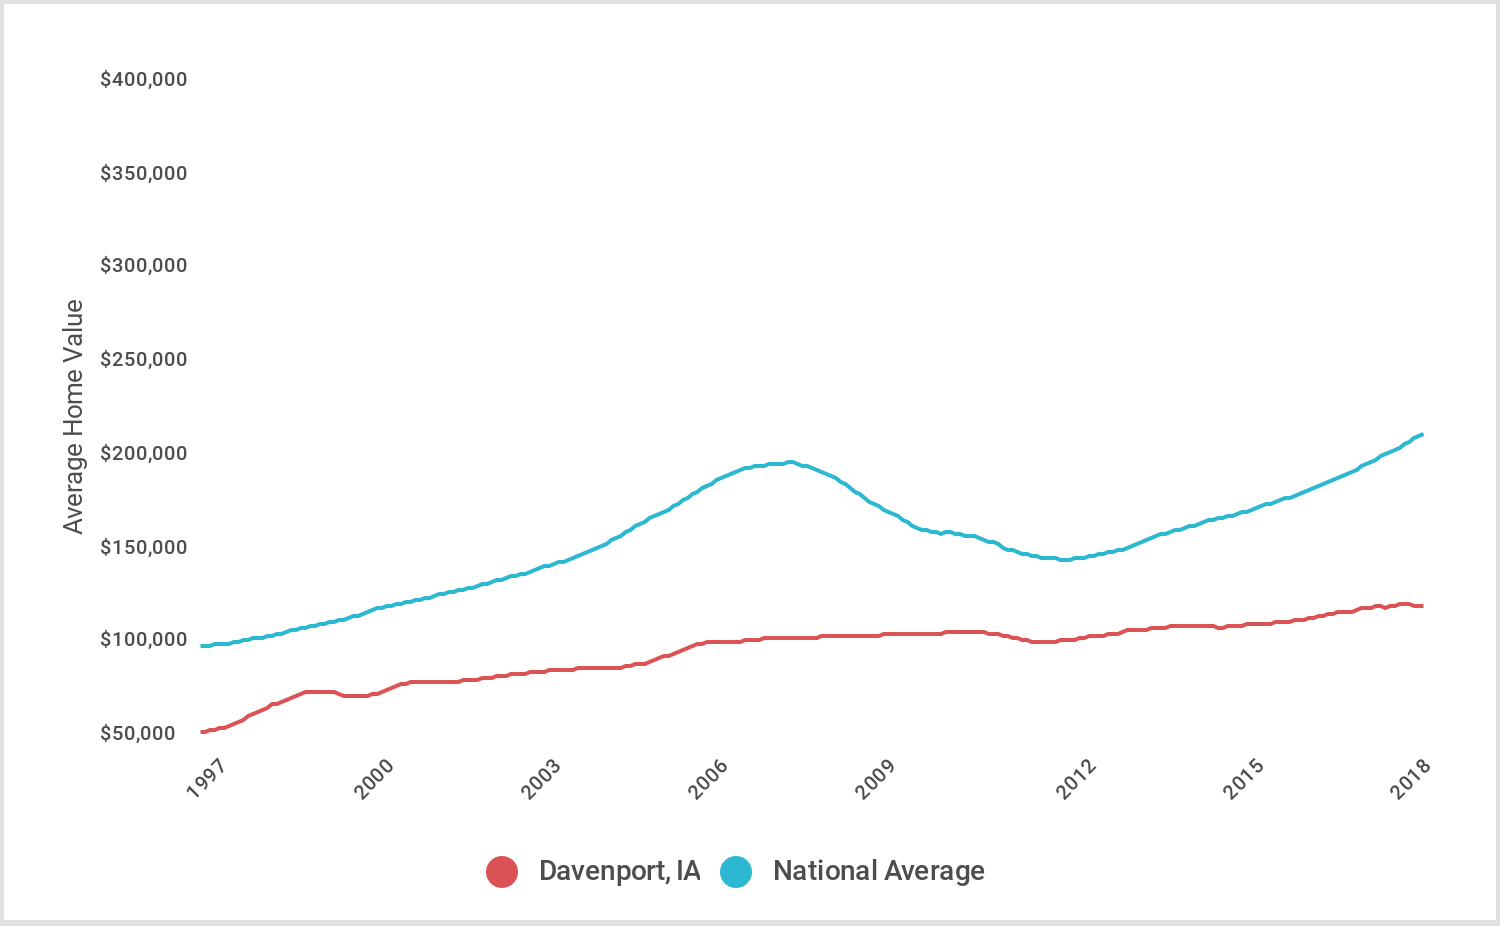
17. Davenport, IA
- Probability of > 5% decrease in value (1997-present): 0.0%
- Largest decrease in value (1997-present): -4.98%
- 20-yr change in value (1997-2017): 105%
- Median list price (Q1 2018): $149,967
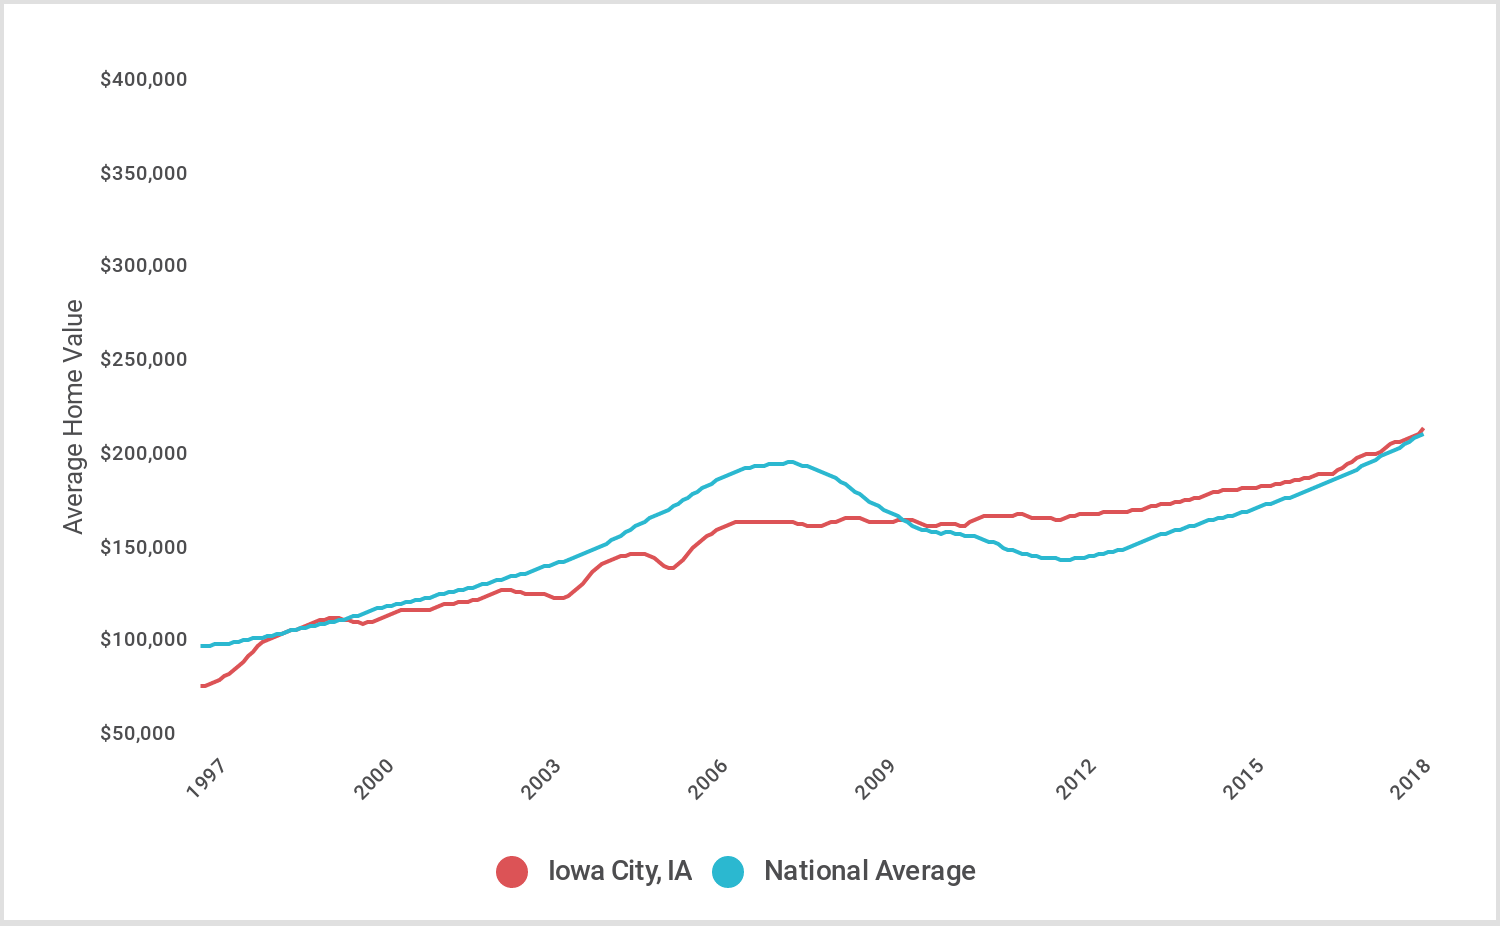
16. Iowa City, IA
- Probability of > 5% decrease in value (1997-present): 0.0%
- Largest decrease in value (1997-present): -4.93%
- 20-yr change in value (1997-2017): 134%
- Median list price (Q1 2018): $288,300
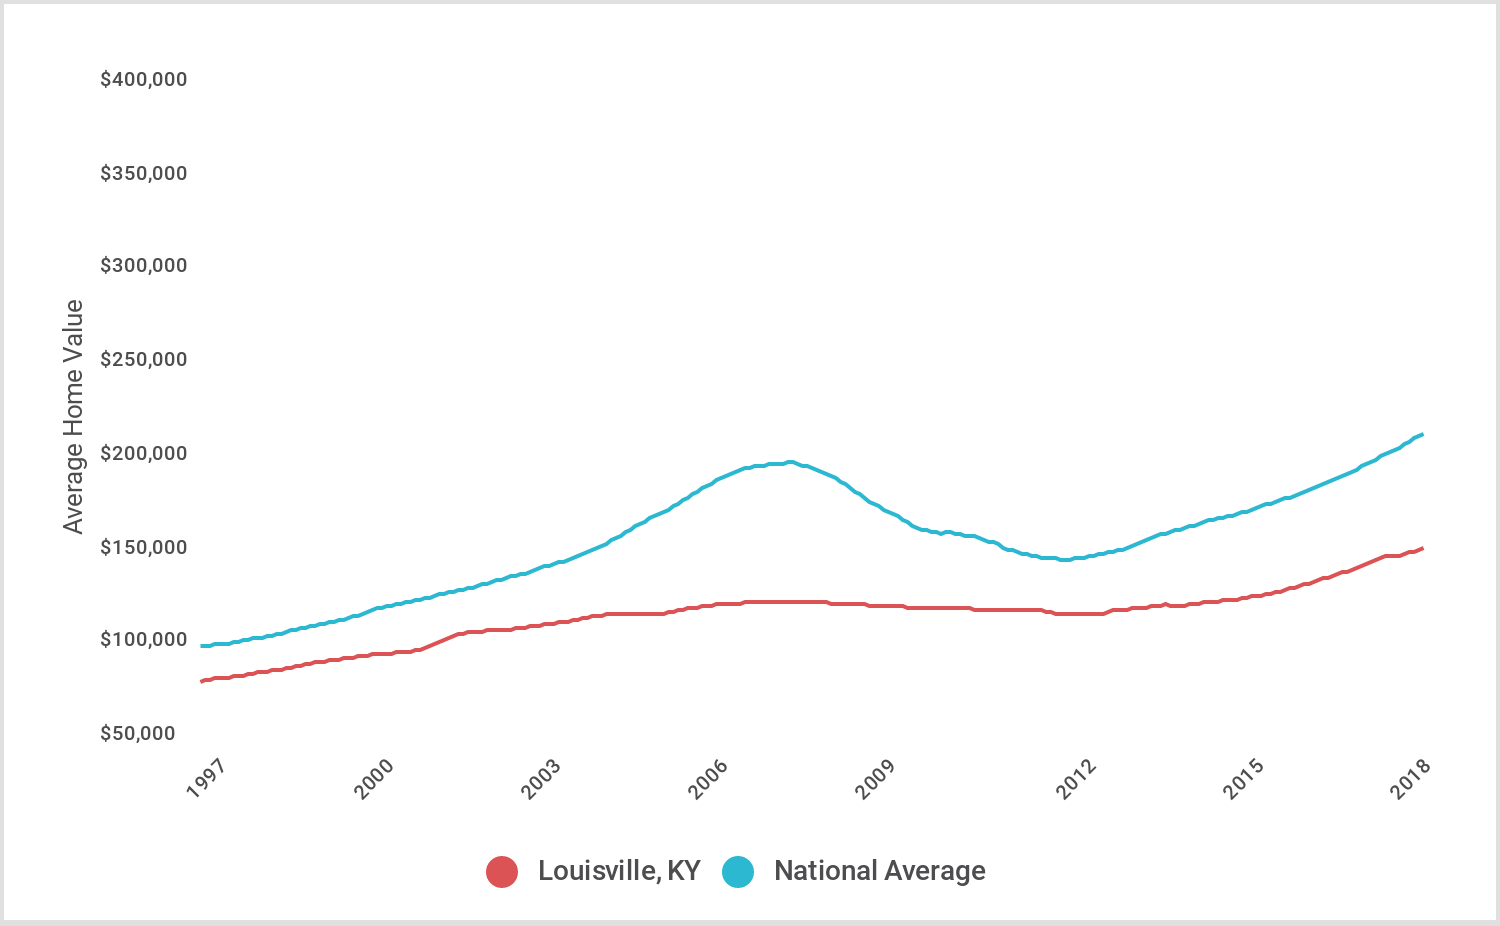
15. Louisville, KY
- Probability of > 5% decrease in value (1997-present): 0.0%
- Largest decrease in value (1997-present): -4.92%
- 20-yr change in value (1997-2017): 72%
- Median list price (Q1 2018): $184,933
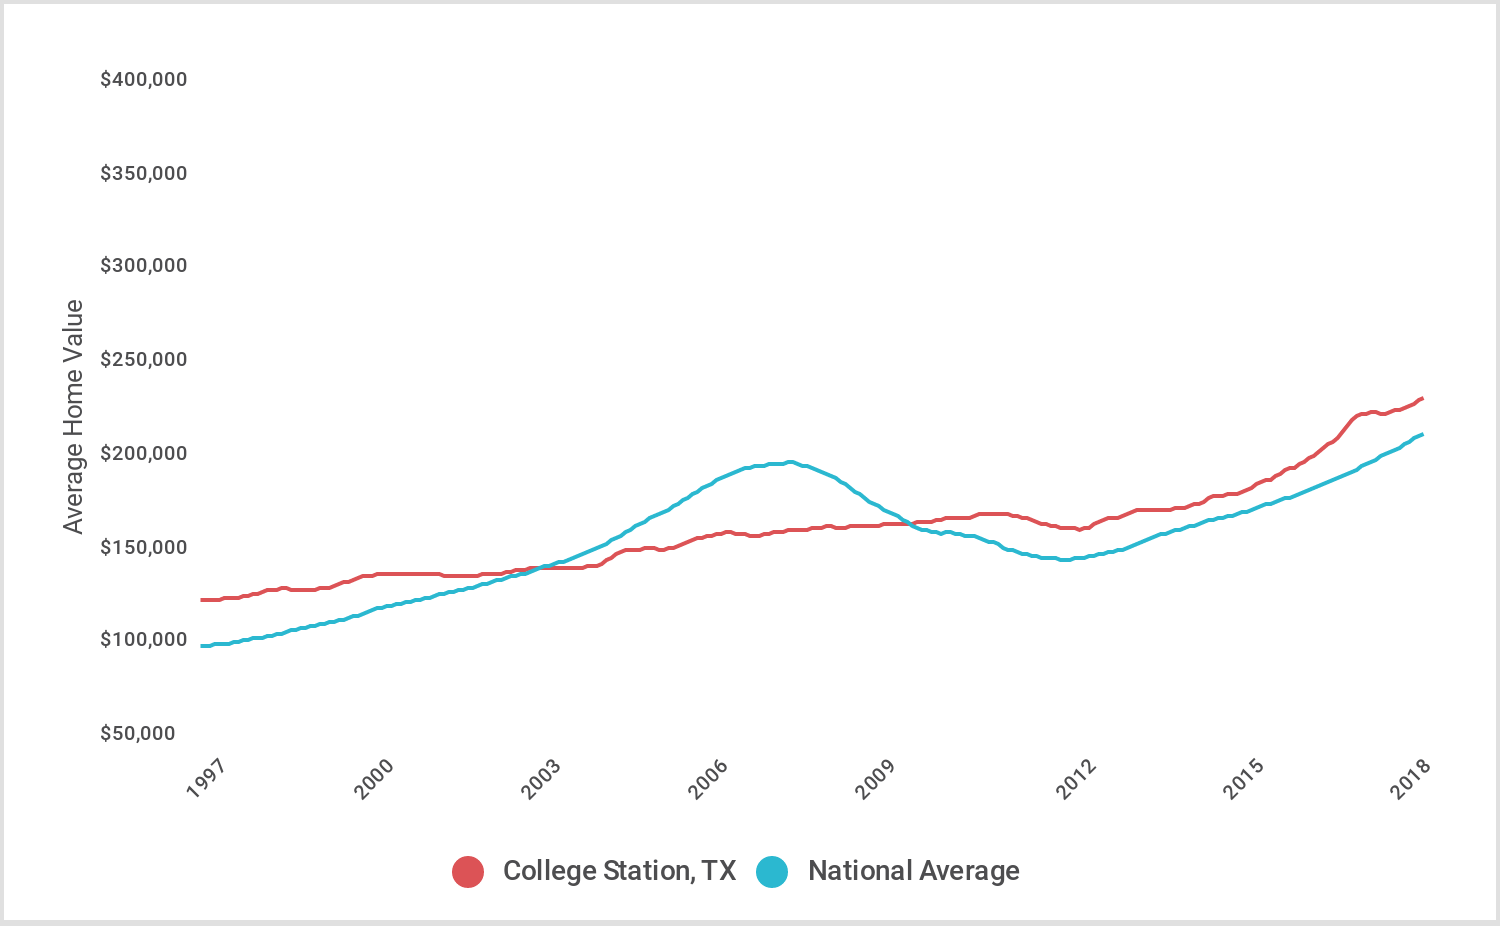
14. College Station, TX
- Probability of > 5% decrease in value (1997-present): 0.0%
- Largest decrease in value (1997-present): -4.85%
- 20-yr change in value (1997-2017): 77%
- Median list price (Q1 2018): $279,100
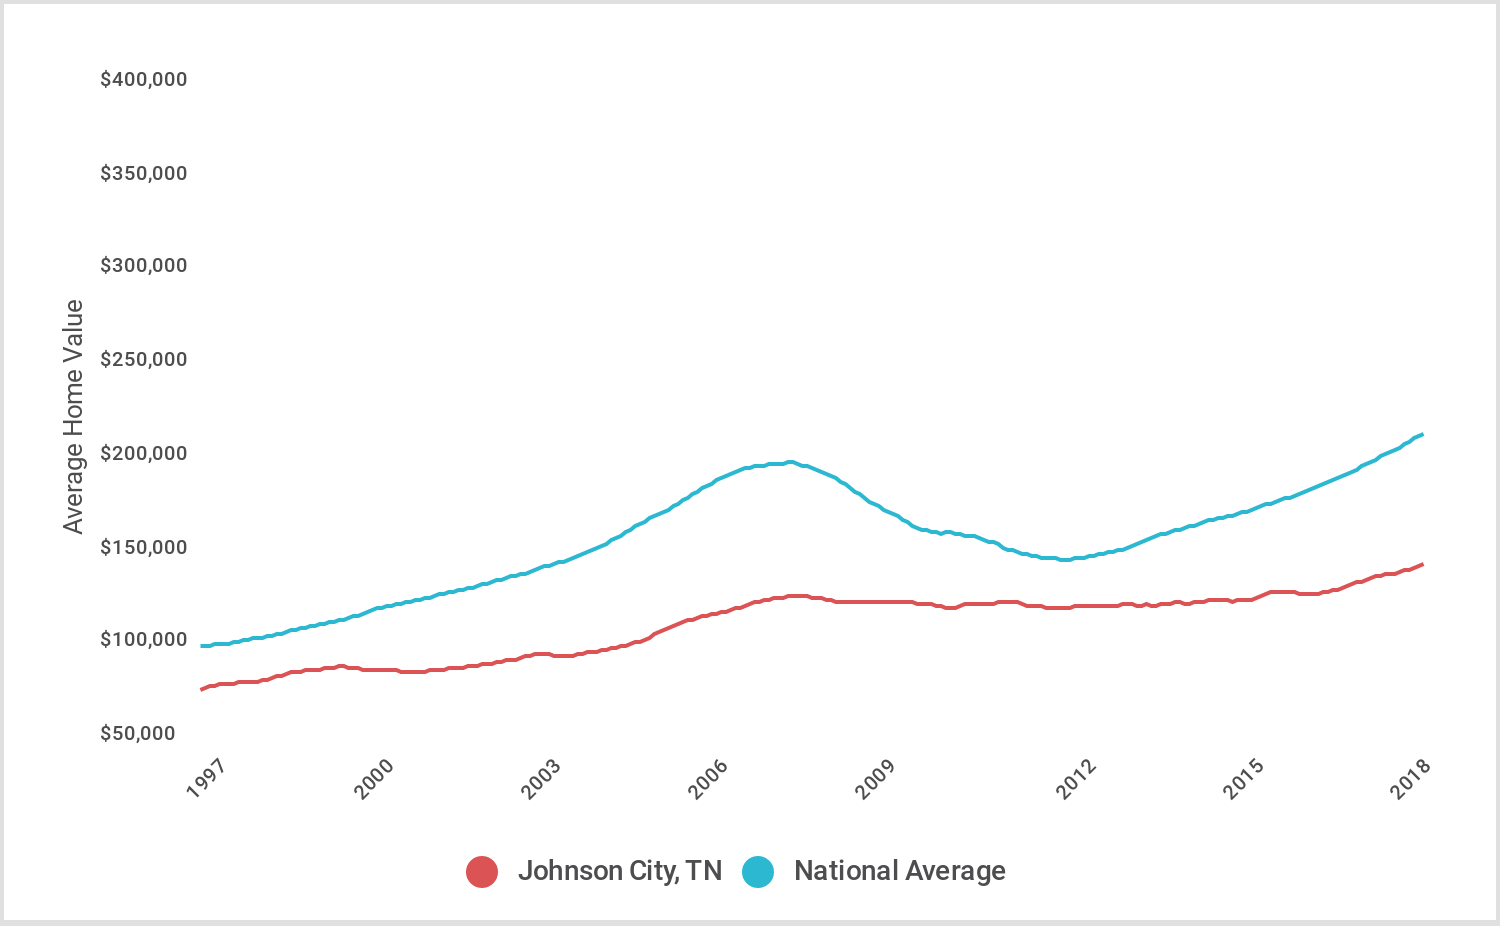
13. Johnson City, TN
- Probability of > 5% decrease in value (1997-present): 0.0%
- Largest decrease in value (1997-present): -4.80%
- 20-yr change in value (1997-2017): 70%
- Median list price (Q1 2018): $193,383
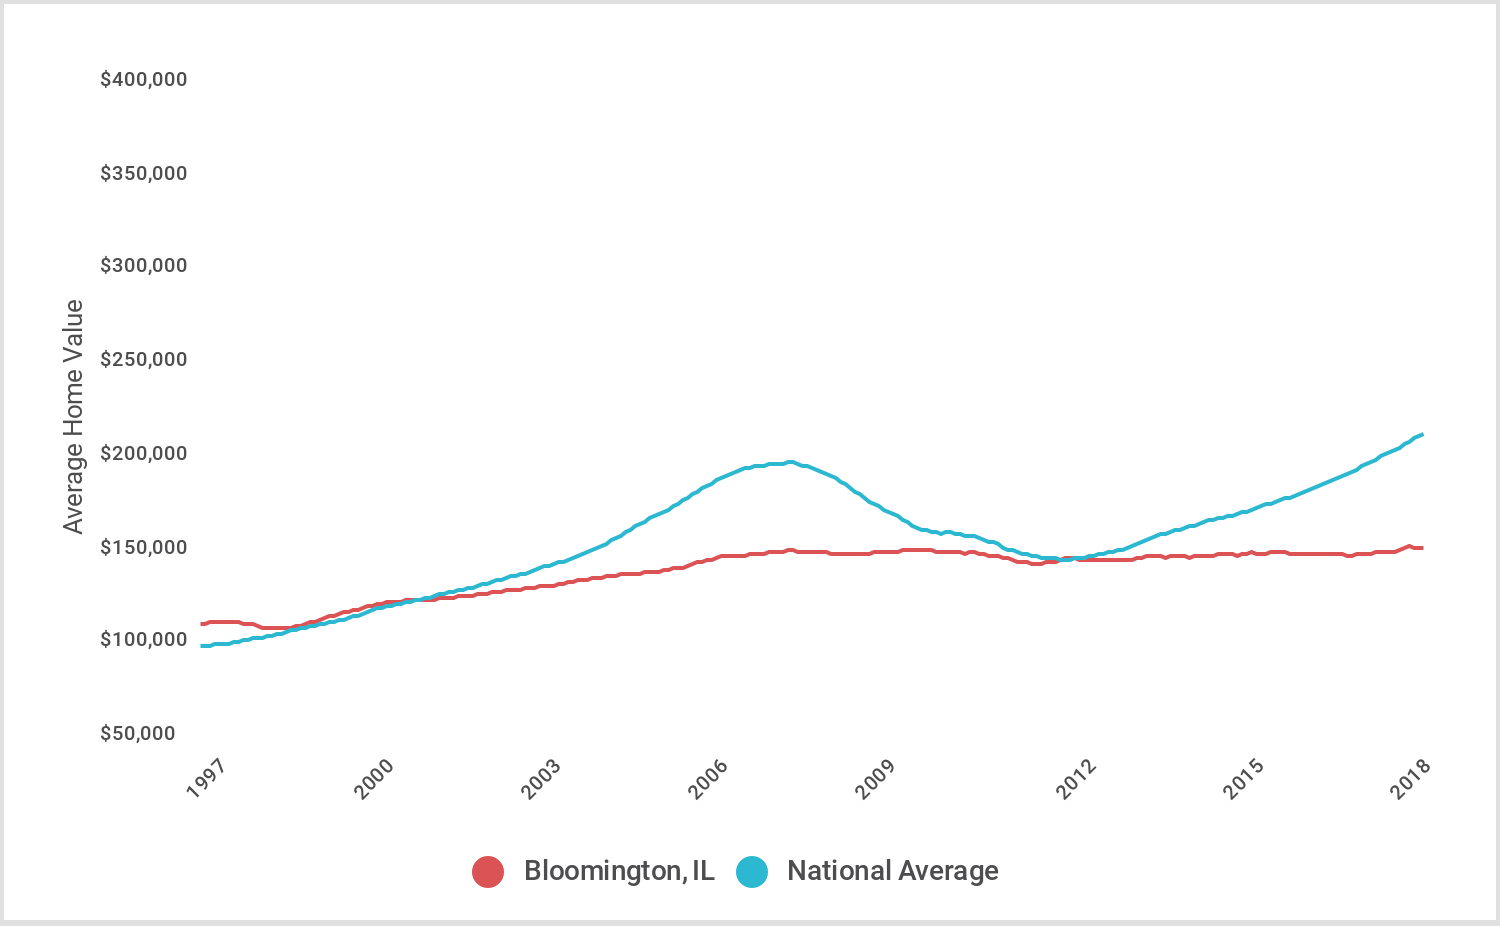
12. Bloomington, IL
- Probability of > 5% decrease in value (1997-present): 0.0%
- Largest decrease in value (1997-present): -4.75%
- 20-yr change in value (1997-2017): 32%
- Median list price (Q1 2018): $185,917
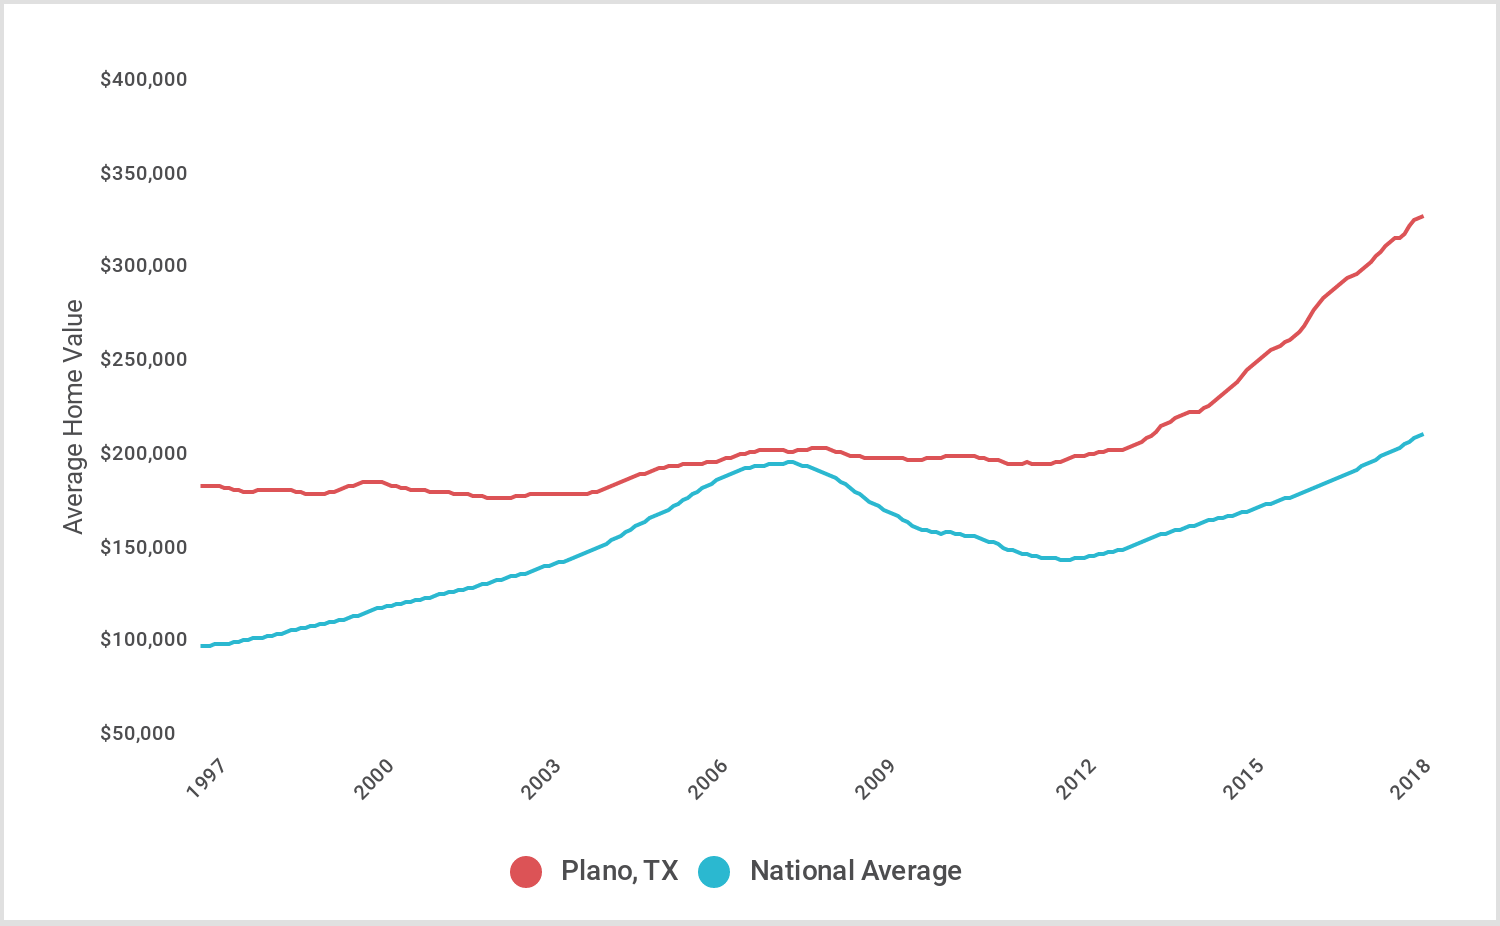
11. Plano, TX
- Probability of > 5% decrease in value (1997-present): 0.0%
- Largest decrease in value (1997-present): -4.57%
- 20-yr change in value (1997-2017): 66%
- Median list price (Q1 2018): $379,667
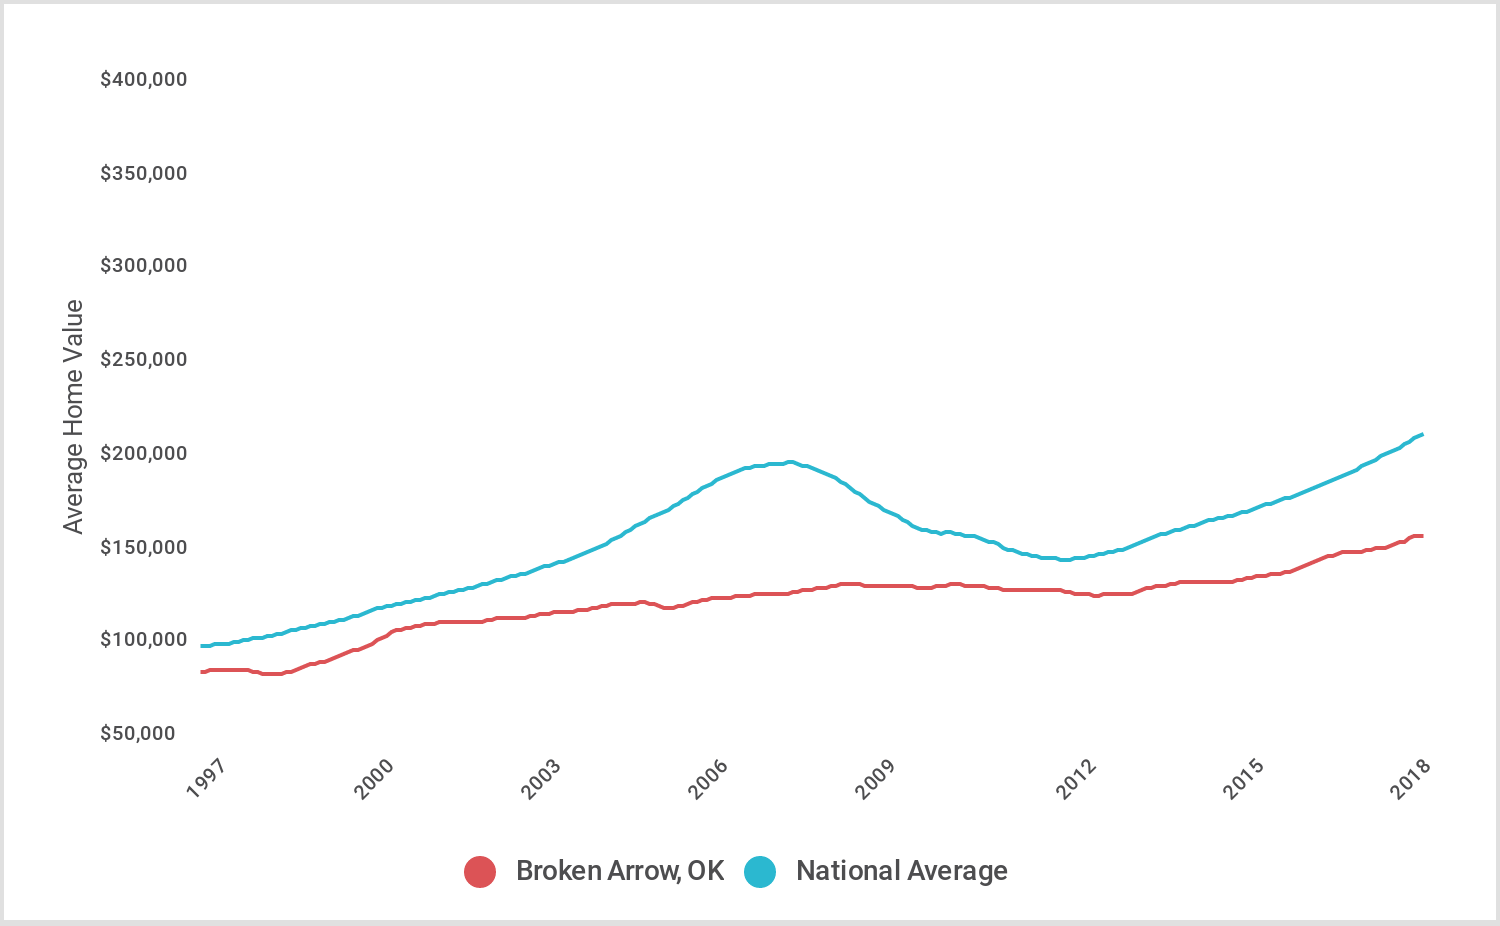
10. Broken Arrow, OK
- Probability of > 5% decrease in value (1997-present): 0.0%
- Largest decrease in value (1997-present): -4.56%
- 20-yr change in value (1997-2017): 73%
- Median list price (Q1 2018): $207,900
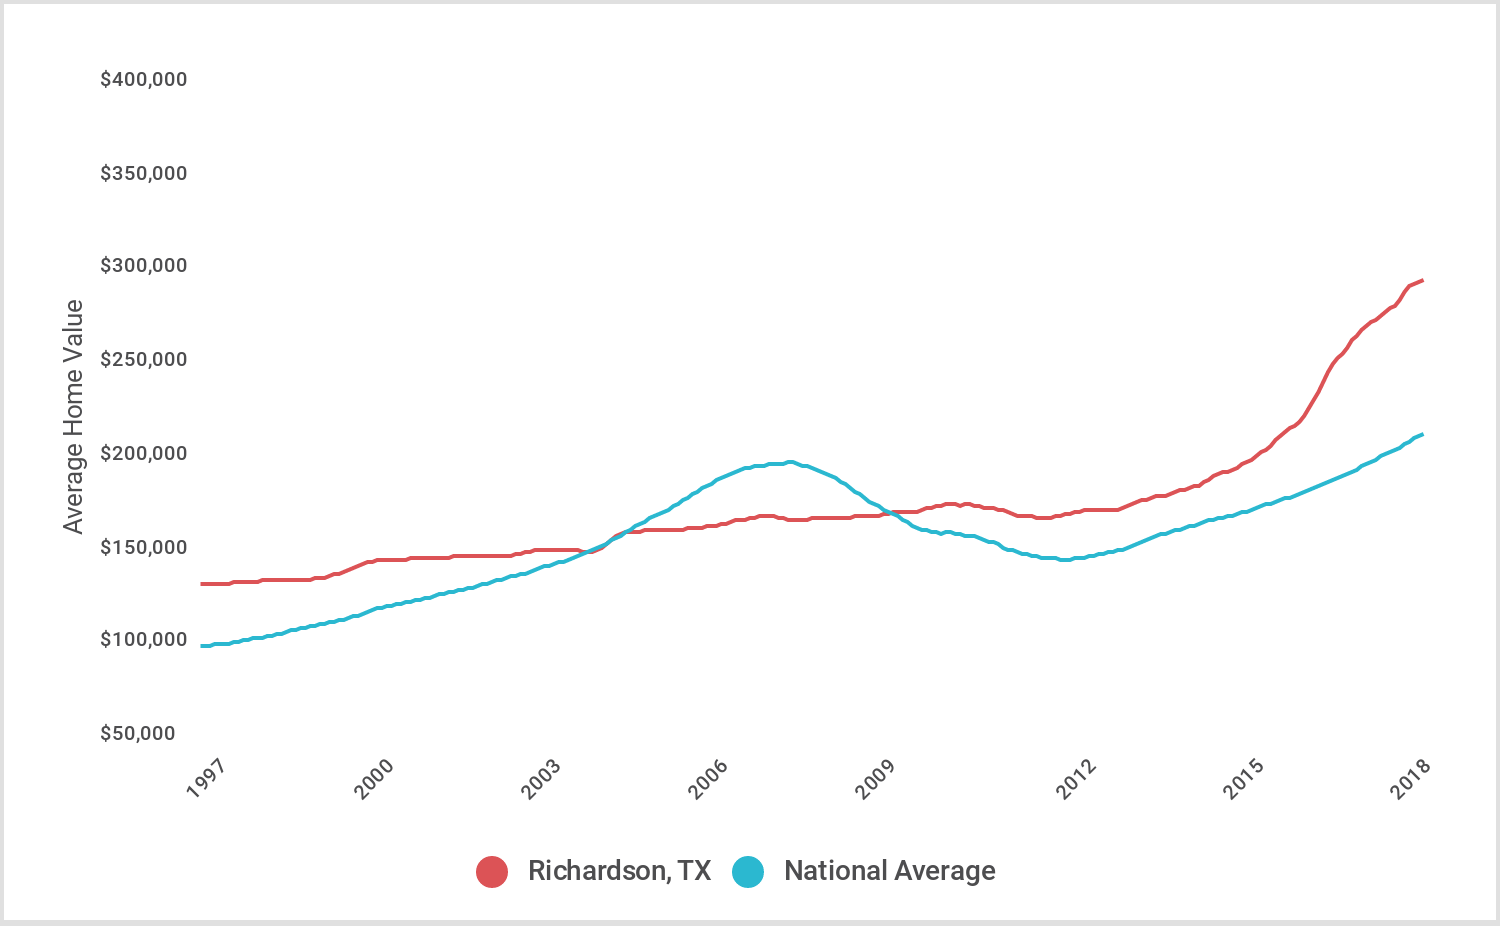
9. Richardson, TX
- Probability of > 5% decrease in value (1997-present): 0.0%
- Largest decrease in value (1997-present): -4.20%
- 20-yr change in value (1997-2017): 103%
- Median list price (Q1 2018): $332,983
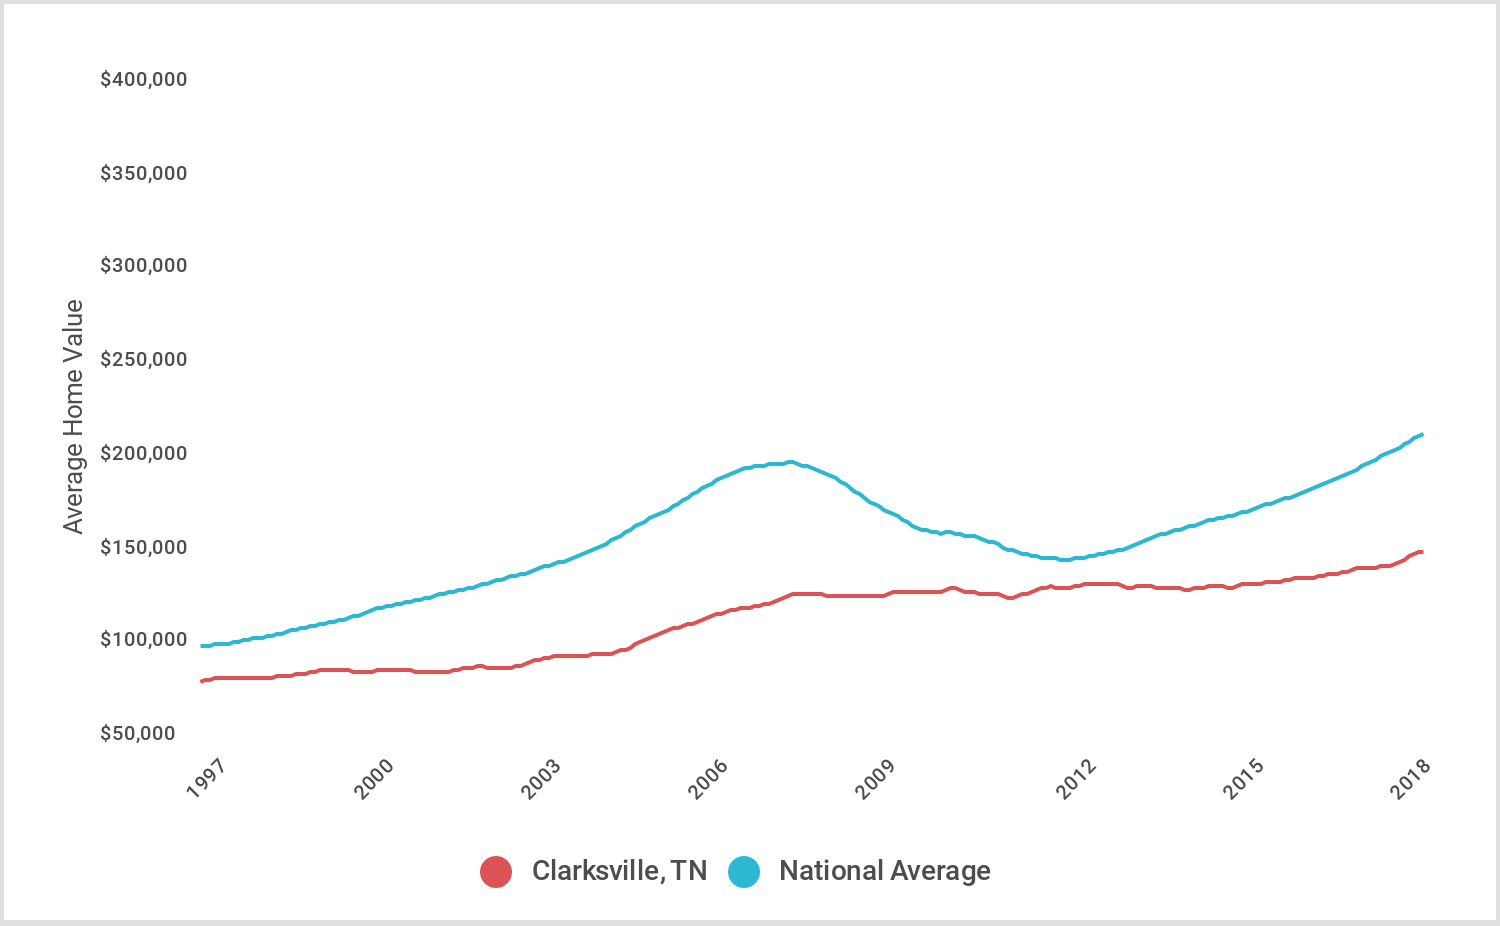
8. Clarksville, TN
- Probability of > 5% decrease in value (1997-present): 0.0%
- Largest decrease in value (1997-present): -3.90%
- 20-yr change in value (1997-2017): 70%
- Median list price (Q1 2018): $203,250
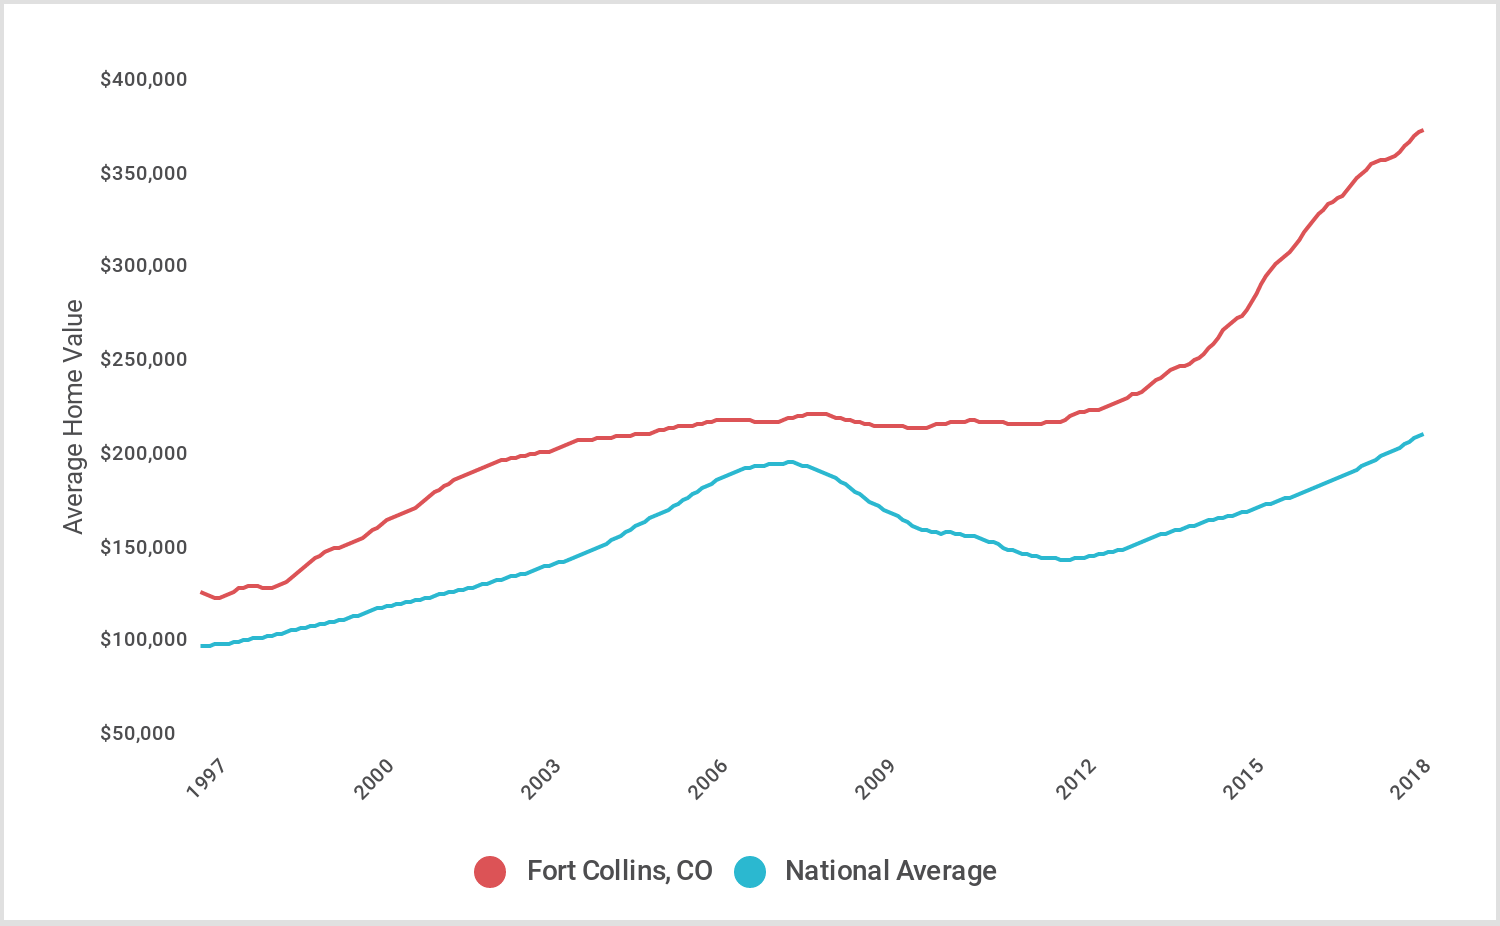
7. Fort Collins, CO
- Probability of > 5% decrease in value (1997-present): 0.0%
- Largest decrease in value (1997-present): -3.66%
- 20-yr change in value (1997-2017): 173%
- Median list price (Q1 2018): $402,344
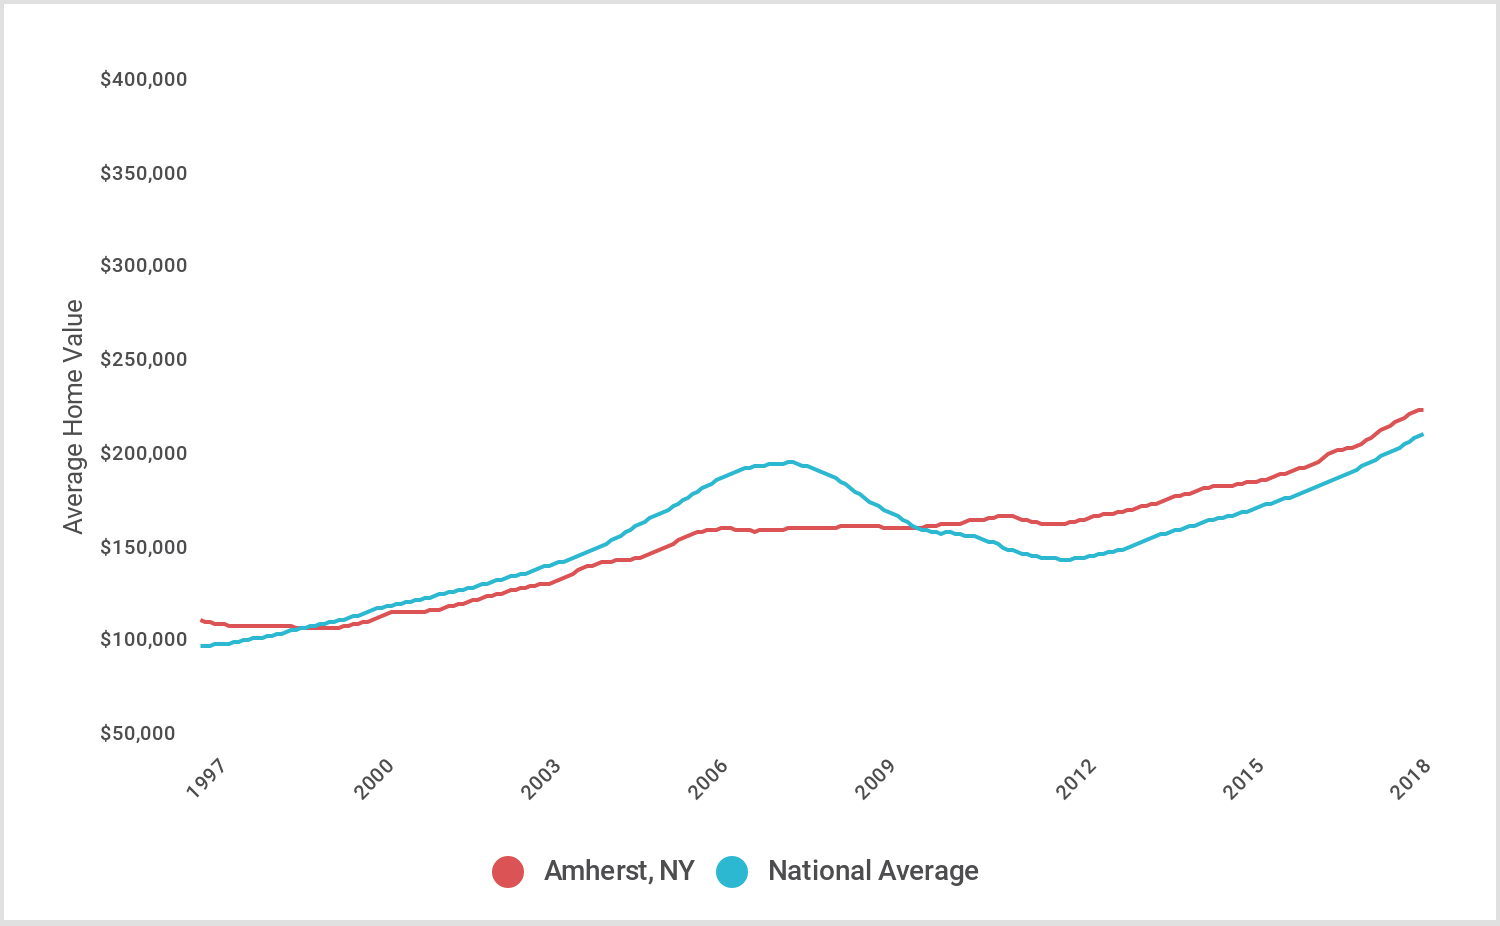
6. Amherst, NY
- Probability of > 5% decrease in value (1997-present): 0.0%
- Largest decrease in value (1997-present): -3.36%
- 20-yr change in value (1997-2017): 89%
- Median list price (Q1 2018): $221,417
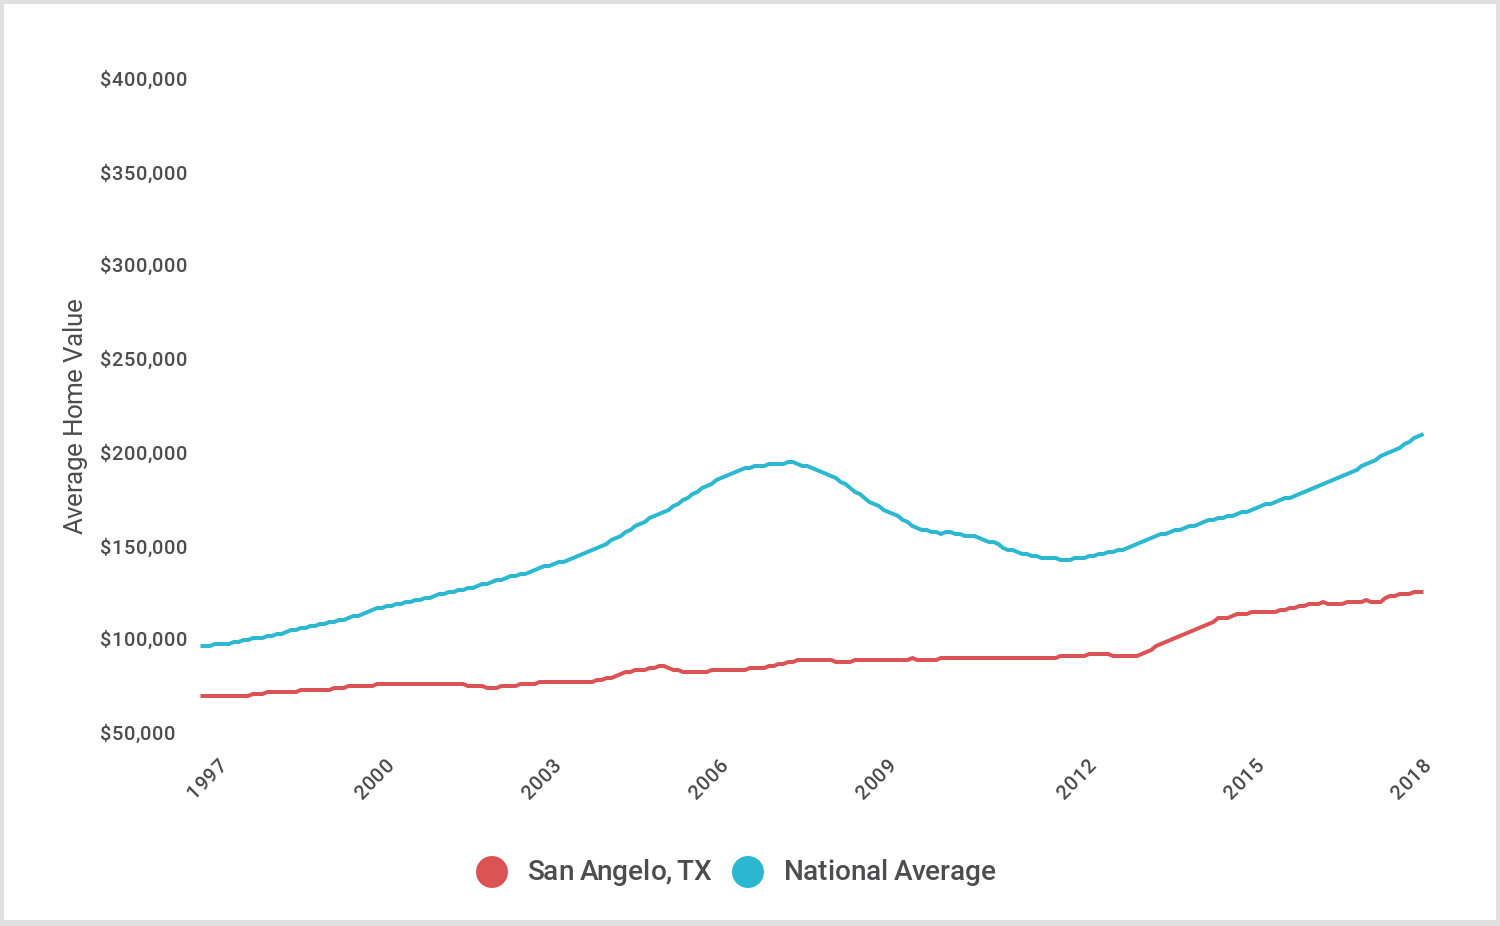
5. San Angelo, TX
- Probability of > 5% decrease in value (1997-present): 0.0%
- Largest decrease in value (1997-present): -3.17%
- 20-yr change in value (1997-2017): 68%
- Median list price (Q1 2018): $168,717
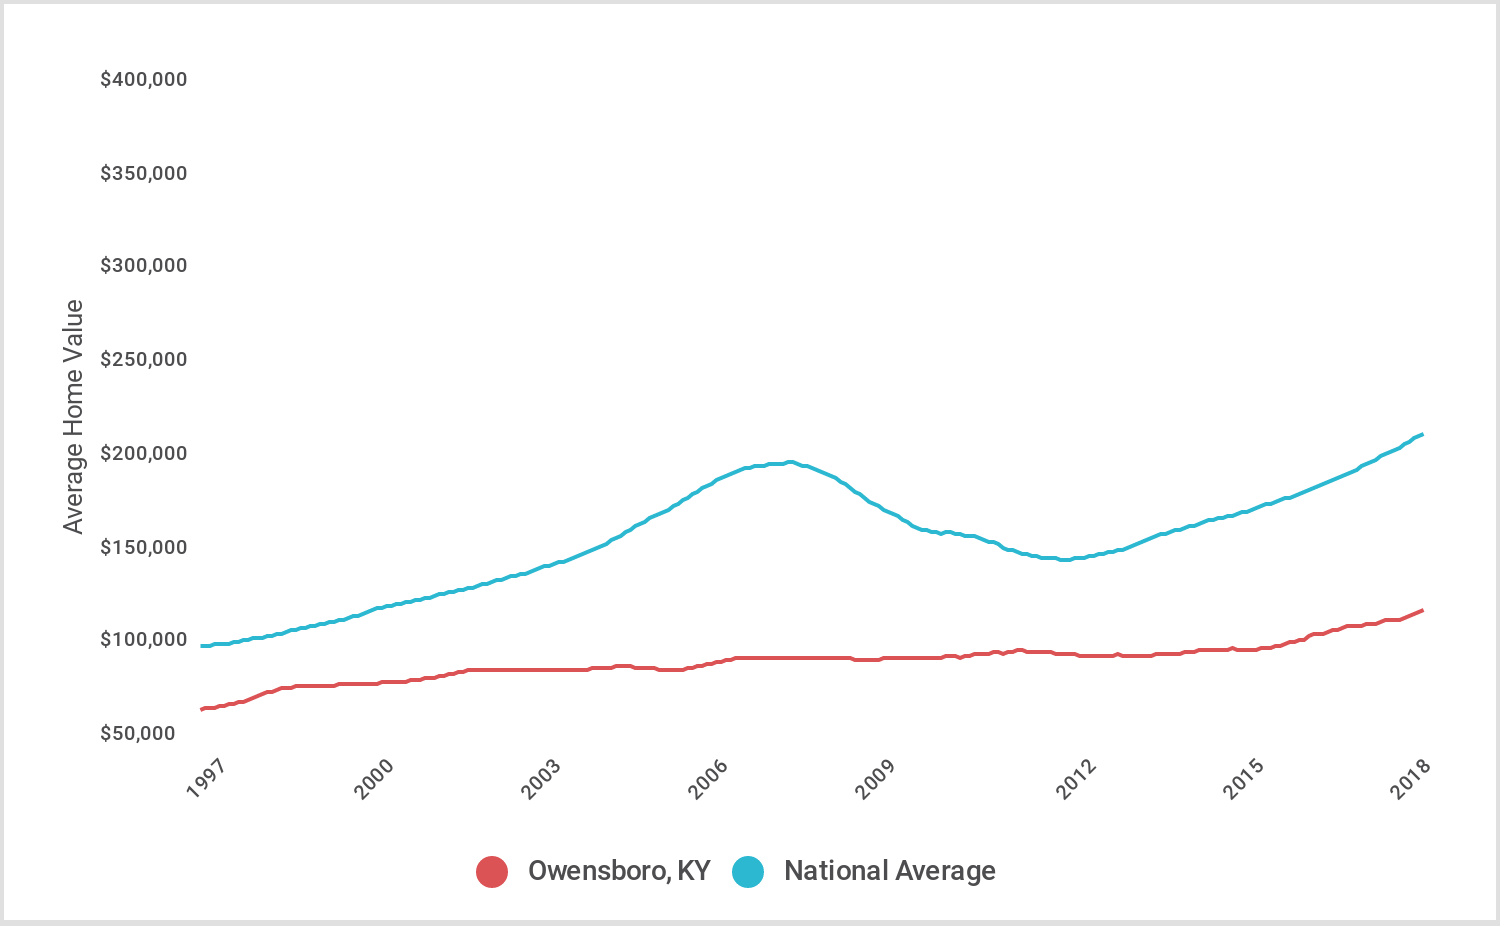
4. Owensboro, KY
- Probability of > 5% decrease in value (1997-present): 0.0%
- Largest decrease in value (1997-present): -3.11%
- 20-yr change in value (1997-2017): 61%
- Median list price (Q1 2018): $185,933
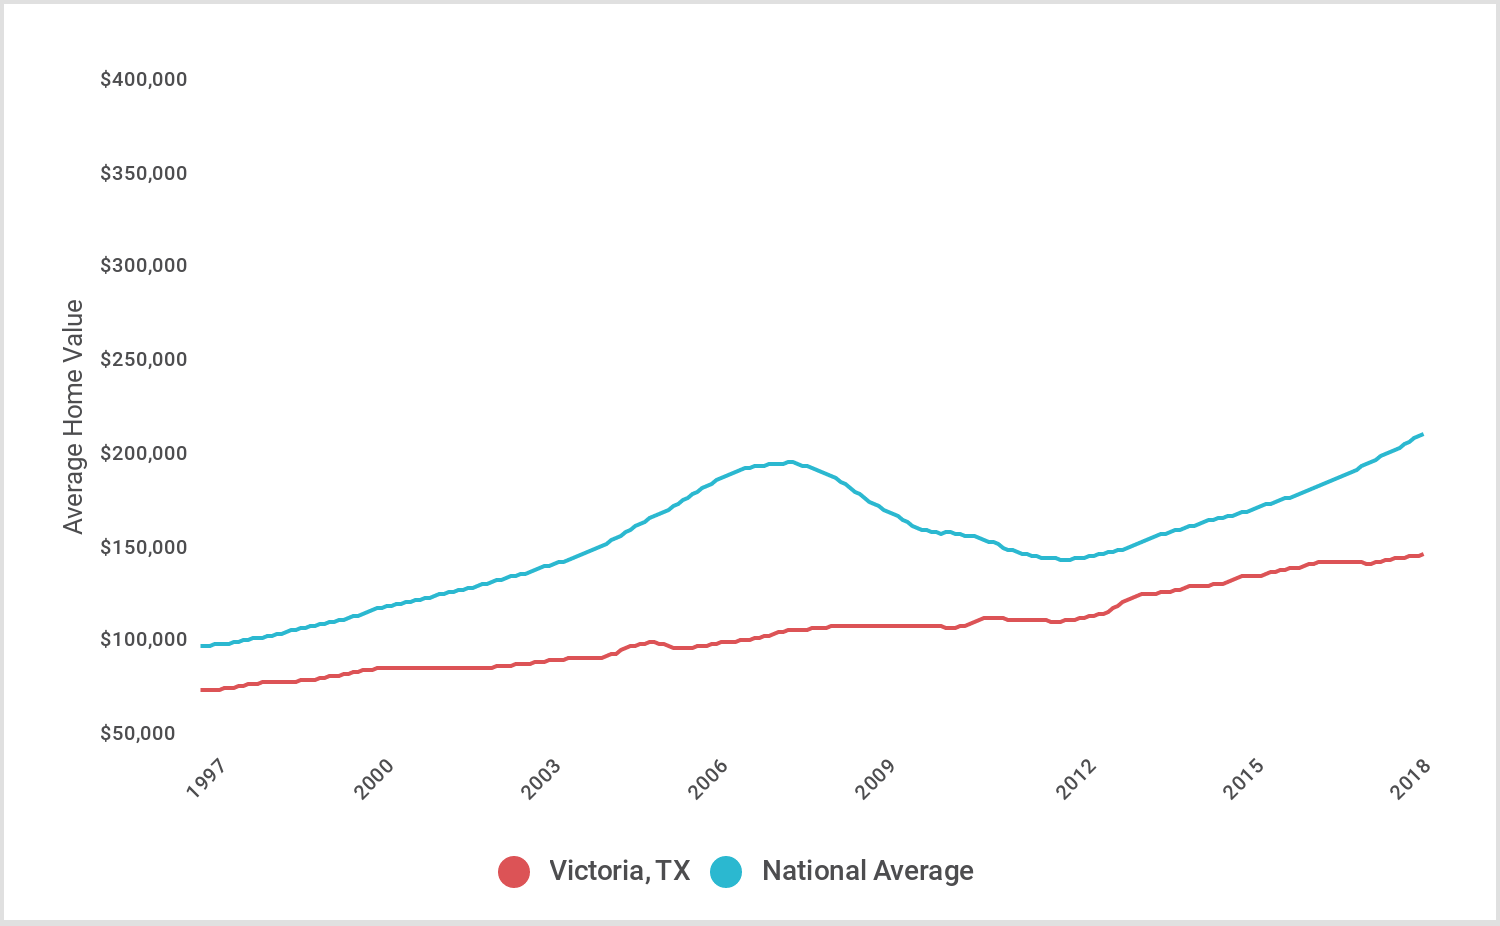
3. Victoria, TX
- Probability of > 5% decrease in value (1997-present): 0.0%
- Largest decrease in value (1997-present): -2.79%
- 20-yr change in value (1997-2017): 85%
- Median list price (Q1 2018): $194,267
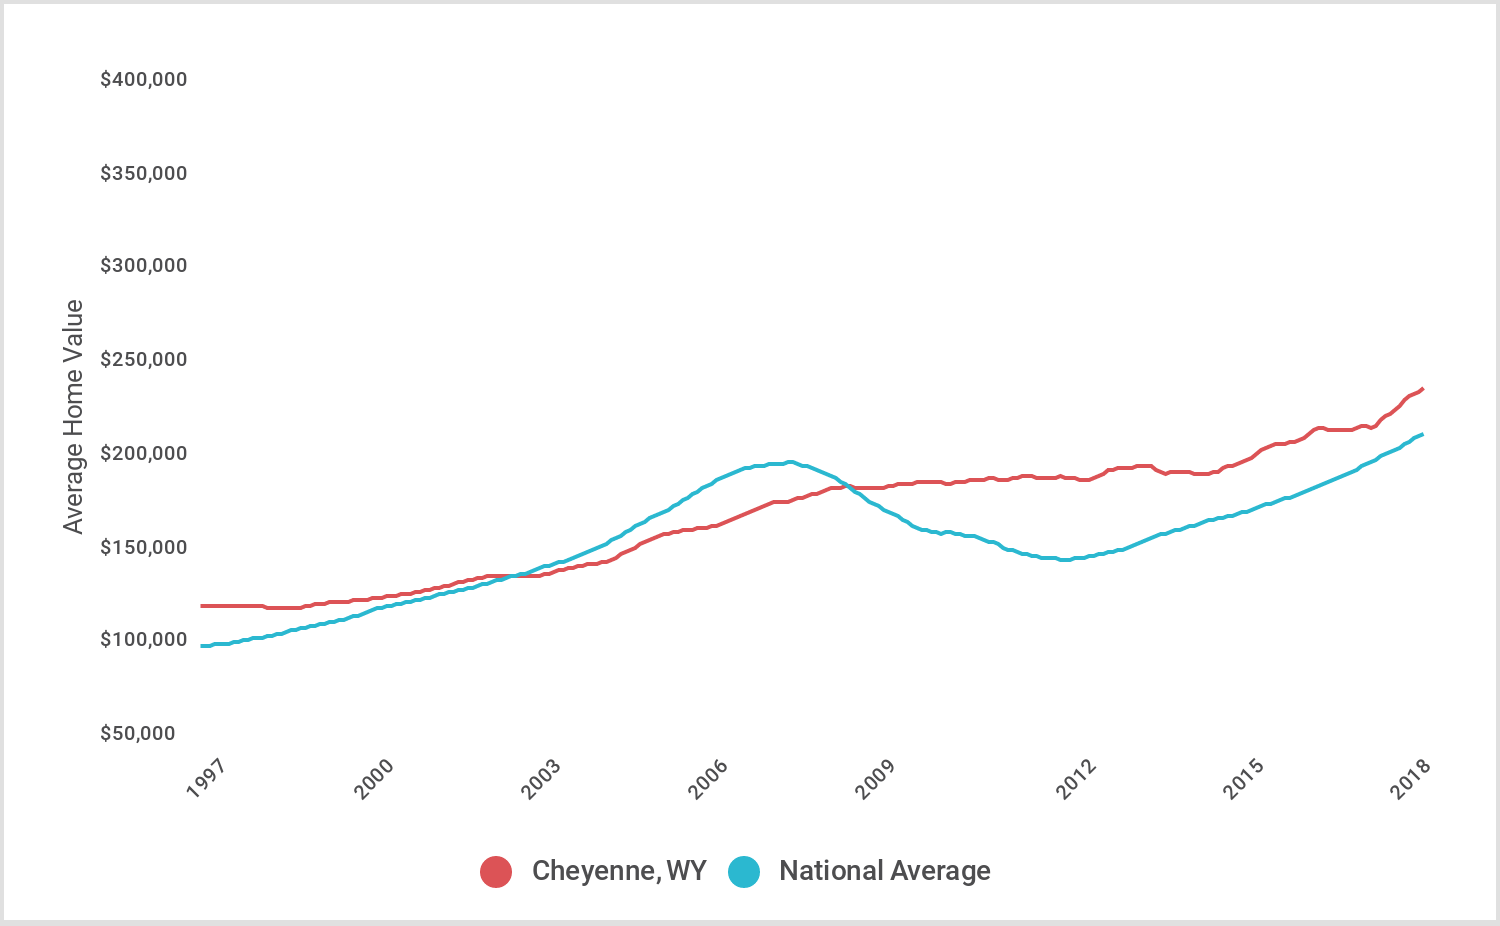
2. Cheyenne, WY
- Probability of > 5% decrease in value (1997-present): 0.0%
- Largest decrease in value (1997-present): -2.66%
- 20-yr change in value (1997-2017): 80%
- Median list price (Q1 2018): $271,533
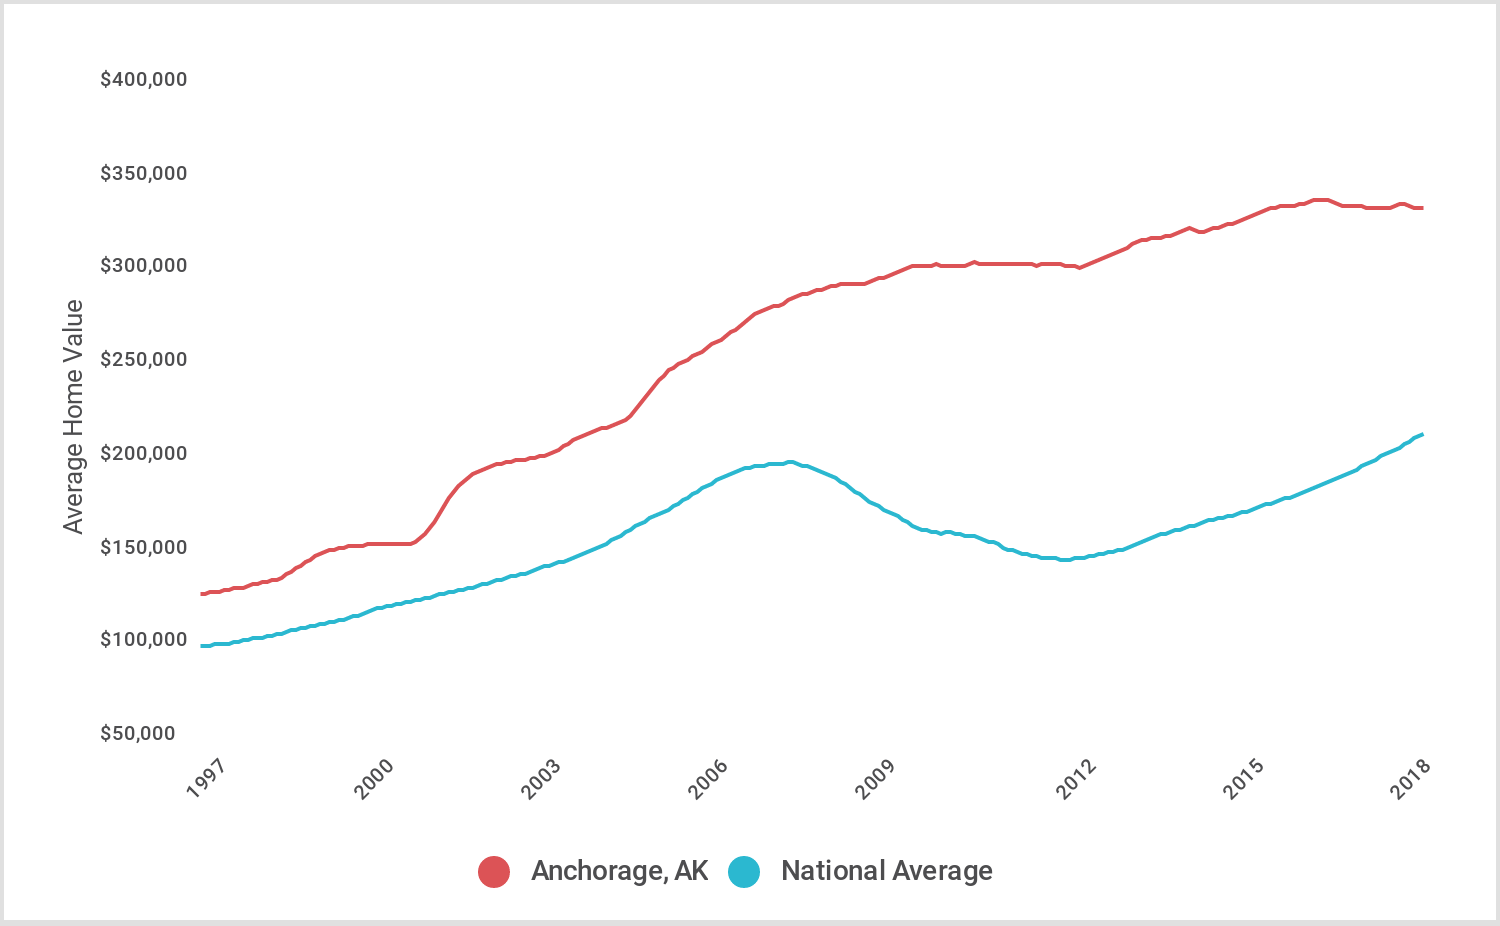
1. Anchorage, AK
- Probability of > 5% decrease in value (1997-present): 0.0%
- Largest decrease in value (1997-present): -1.52%
- 20-yr change in value (1997-2017): 155%
- Median list price (Q1 2018): $302,367
Methodology
The data used in this analysis is from Zillow Group’s Zillow Home Value Index (ZHVI) for all homes. The “ZHVI All Homes” is a home price index for U.S. cities that includes single family residences, condominiums, and cooperative housing complexes.
To identify “recession-proof” housing markets, for each city and month beginning in 1997, we looked at whether the city’s ZHVI would drop by more than 5 percent at any point in the future. Using the results, we calculated the probability that a homebuyer would experience a greater than 5 percent decrease in value at any time between 1997 and present. Cities on this list have a probability of zero (e.g. at no point between 1997 and present did their ZHVI drop by more than 5 percent). For each city, we also calculated the largest decrease in value between any two months from 1997-present. By definition, these values are all less than 5 percent for the cities listed.
The 20-year change in value compares the average ZHVI for 1997 to the average ZHVI for 2017, which is the most recent complete calendar year of data available. The median list price for Q1 of 2018 is the average median list price for January, February, and March of 2018 for all homes using data from Zillow Group. The analysis is limited to the largest 500 city real estate markets.
More From 104-5 KDAT